A recent HFS study on machine learning (ML) adoption, shows ML one of the biggest categories of AI techniques and applications.
About 63% of enterprise respondents (see Exhibit 1) mentioned they see the biggest impact of this technology on reducing operating costs, and more than 50% said they see it impacting their revenue growth with existing business models. The question is: How effectively are enterprise AI leaders measuring and reporting the value and impact of their AI investments on both their leadership and the market?
Exhibit 1. Where is machine learning expected to provide impact?
What is the biggest source of business impact you expect from using machine learning?
 Sample: 153 senior level executives from organizations with $1 billion or more in revenues
Source: HFS Research, 2018
Enterprise leaders are expecting significant impact from AI and automation technologies on their operating costs and revenue growth, because the investments are high:
- AI and automation technologies—whether on-premise or cloud—are expensive.
- These require long-term investments not only in new technologies and platforms but also in people. New skills are hired at a premium; retraining and certifications also require investment.
- There are process transformation costs due to expensive consulting engagements for massive process reengineering and organizational changes.
Right now, AI is in its heyday with money pouring in from central corporate functions and business unit leaders sponsoring and even initiating AI programs. Once this zest of gestation is over, the inevitable question will start hounding AI evangelists across the technology and business spectrums.
Where did all the money go?
To answer that imminent question, it is imperative that AI leaders have solid pre and post measures defined and monitored, at least on the processes that are the first candidates for AI and automation transformation.
Some common metrics organizations are already reporting include:
- The percentage of process instances, contacts, tickets, or service requests executed through AI and IA applications in full-autonomous, autonomous-assisted, or full-manual modes. Organizations report that approximately 15% to 35% of the total volume of tickets, contacts, and SRs are executed in autonomous mode.
- The percentage of coverage of tasks or activities in a process, by AI and IA use cases, for example the percentage of activities done autonomously in a software testing process, software development, design, analysis processes, or routine business processes. E.g. Approximately 25% to 30% of software testing activities are executed through AI and autonomous modes.
However, these are only activity metrics, and they don’t directly reflect cost reductions or gains in business value. You need both bottom-line and top-line metrics to measure project impact.
Business relevant metrics and KPIs for AI and automation will have two key aspects:
- Cost and bottom-line-based metrics, for example the impact of AI and IA use cases on process costs, transaction costs, contact costs, communication costs, customer service costs, and service request fulfillment costs.
- Value and top-line-based metrics, for example the impact of AI and IA use cases on revenue-enabling metrics like time to market (TTM), time to value (TTV), customer satisfaction (Csat), and Net Promoter Score (NPS).
Exhibit 2: Examples and indicative benchmarks for business-relevant AI key value metrics
|
Impact |
Example metrics and KPIs |
Specific use case and process examples |
Indicative benchmarks (achieved by some early adopters) |
|
Cost-based and bottom-line-impacting KPIs |
Cost of fulfilling service requests |
IT service requests, standard business service requests |
30% to 50% cost reduction achieved, depending on depth of AI applications |
|
Cost of transactions |
Autonomous ordering |
40% to 60% cost reduction in autonomous mode |
|
|
Cost of contact or communication |
Chat-based customer service |
50% to 60% reduction in cost-per-chat instance-based pricing |
|
|
Cost of ticket resolution |
IT incident resolutions |
40% to 60% reduction based on complexity, e.g., L1, L2, or L3 |
|
|
Cost of a part or whole business process |
Fraud detection |
70% to 80% reduction in autonomous mode |
|
|
Value-based and top-line-impacting KPIs |
Time to market |
Solution development |
Minimum 60% to 70% faster TTM |
|
Time to value |
Customer relationship going live in a retail banking or telecom scenario |
Minimum 2x to 3x faster TTV |
|
|
Customer satisfaction score |
Faster fulfilment, reduced waiting time in autonomous mode |
50% to 60% improvement |
|
|
NPS |
Improved customer experience and consistency, reduced human errors |
40% to 50% improvement |
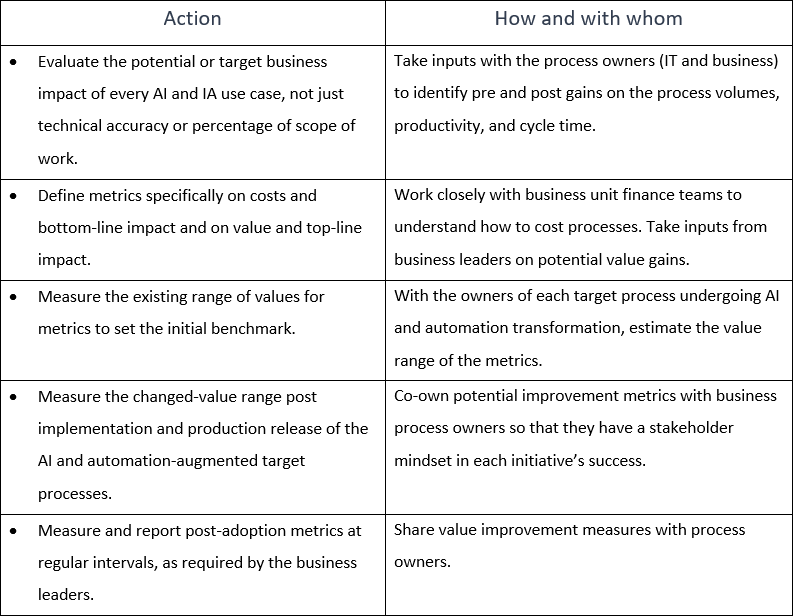
Start now: Action items for next Monday morning
AI practitioners and leaders must define the key value and impact metrics from their AI programs in a business-relevant manner.
Exhibit 3: Action items for next Monday morning
Bottom line: If you are measuring the wrong metrics, you are starting it all wrong
Business leaders are eager to see tangible gains from AI investments. In the absence of visible non-linear improvements in key business outcomes resulting from these investments, businesses will soon start questioning AI initiatives. To respond effectively to those pertinent questions, enterprise AI leaders must build business-relevant cost and value metrics definitions and measurement procedures for all their AI and automation initiatives.